
Cab trajectory visualization for Chicago
Introduction
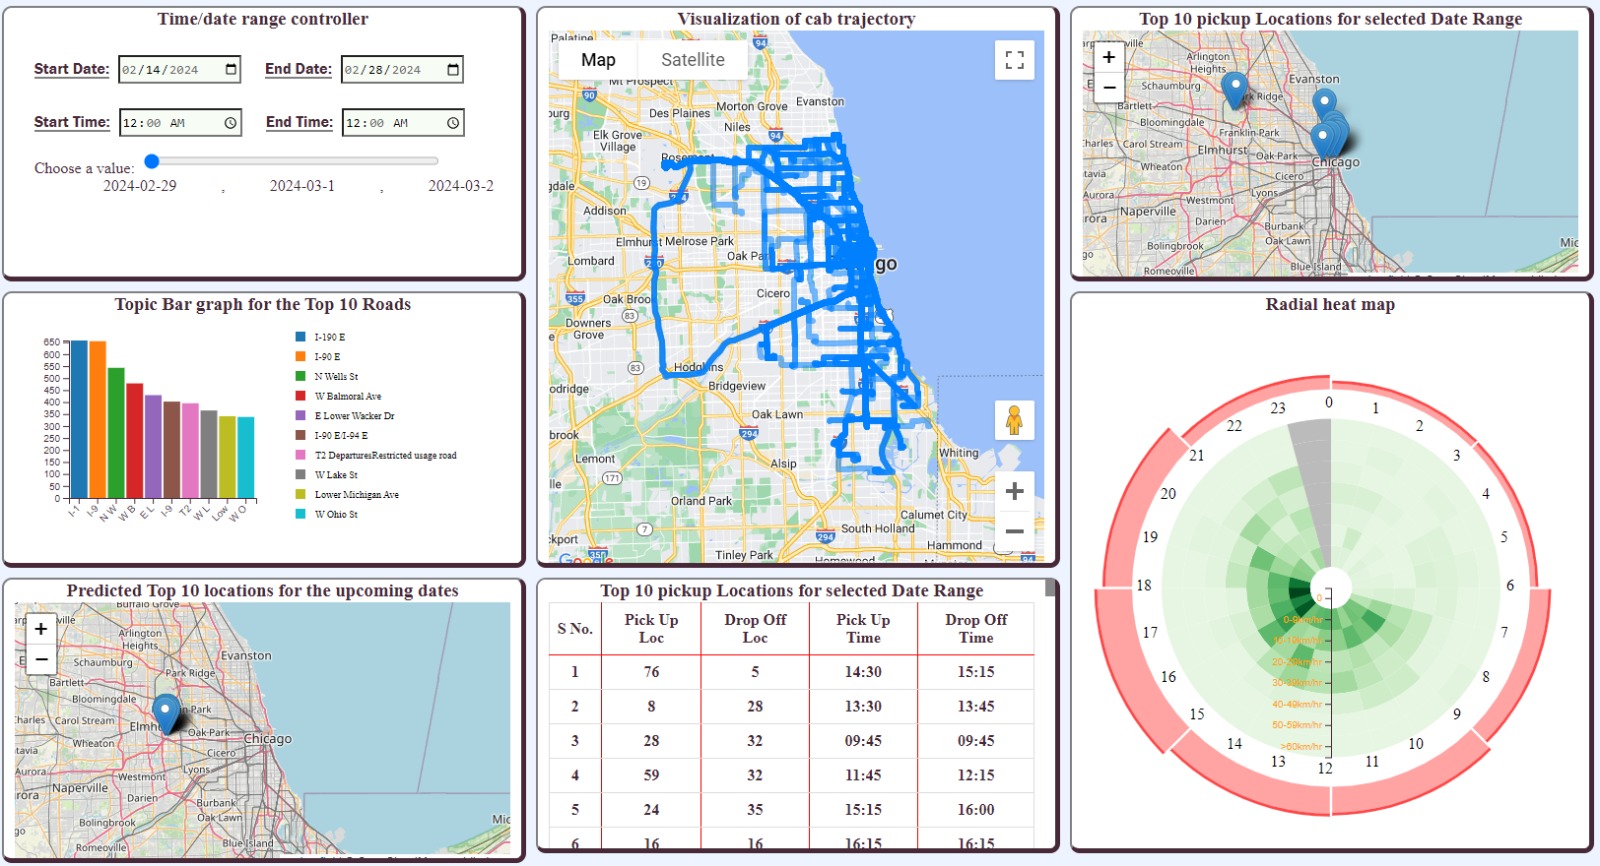
Visualizing the paths taken by taxis is crucial for managing traffic flow efficiently in modern cities. This visualisation provides city policymakers and cab operators with insights into traffic patterns and popular routes, enabling informed decisions that optimize both business operations and urban infrastructure.
Visualisation Design
The visualisation board has been thoughtfully structured into a grid layout, precisely
divided into three columns and
three rows. This layout accommodates a total of seven distinct graphs, each offering unique
insights into the taxi data.
The uniform and symmetrical arrangement of these graphs ensures a cohesive and visually
pleasing presentation, allowing
users to easily navigate and interpret the diverse visualisations provided.
By organising
the graphs in a structured
grid, the landing page optimises the use of space and facilitates efficient data exploration
for users. The seven
visualisations included in this layout provide comprehensive information about various
aspects of the taxi data, ranging
from spatial distributions to temporal patterns and ride characteristics.
Working of Visualization
Bar Graph
At the core of our visual analytics tool lies the Topic Bar Graph, meticulously designed to reveal the most frequently traveled roads based on taxi trajectories. Powered by D3.js, this interactive bar chart dynamically represents road frequencies extracted from pre-filtered taxi trip data. It processes trip details, extracts road names using the Google Maps Directions API, calculates frequency statistics, and visually displays the top ten most traveled roads. Users can interact with the graph to gain instant insights into road usage patterns critical for traffic management and operational strategies.
Radial Heat Map
Another essential component, the Radial Heat Map and Bar Chart, visualizes taxi ride characteristics such as speed and duration across different times of the day. Leveraging D3.js's arc functionalities, this dual visualization uses concentric circles to depict speed intervals and a circular bar chart for ride counts per three-hour intervals. Interactive controls allow users to specify time frames, updating the display dynamically to highlight relevant data segments. Smooth transitions enhance user engagement, ensuring a seamless exploration experience across various temporal contexts.
List View
Complementing graphical representations, the List View offers a detailed tabular summary of taxi rides within selected intervals. Organized in a structured format, it provides essential trip details including pickup/drop-off locations, timestamps, and ride counts. This tabular display enables in-depth analysis alongside visual insights, facilitating a comprehensive understanding of the taxi dataset.
Control Panel
Central to user interaction, the Control Panel empowers users with flexible data filtering capabilities. Through dropdown menus and calendar interfaces, users can define specific start/end dates and time intervals, synchronizing data updates across all visualizations. The slider feature extends functionality by projecting future trends based on historical data, offering predictive insights crucial for planning and operational decision-making.

Fig 1: Bar chart showing most common roads
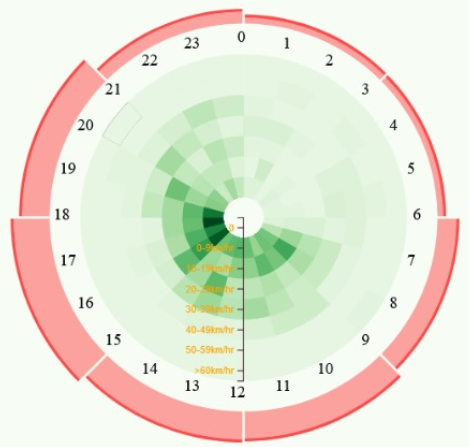
Fig 2: Radial heat map
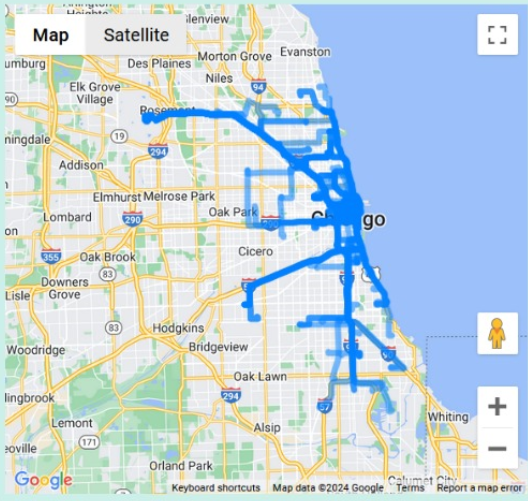
Fig 3: Visualization of Cab trajectory
Practical application
The visualization tool holds immense practical value in urban planning and taxi service
optimization.
By uncovering
traffic patterns, congestion hotspots, and popular pickup/drop-off locations, it equips
stakeholders with actionable
insights to streamline operations, reduce fuel consumption, and enhance service efficiency.
Predictive capabilities
further bolster decision-making, enabling proactive strategies in response to changing urban
dynamics.
Conclusion
In summary, visualizing taxi trajectories empowers stakeholders with critical insights for managing urban transportation effectively. By leveraging advanced visualization techniques and interactive functionalities, this tool not only enhances understanding of taxi behavior but also supports the development of smarter, more efficient urban environments. As cities evolve, such tools play a crucial role in shaping sustainable and responsive transportation systems.
List of APIs used:
Language and libraries used:
Project Demo Video