
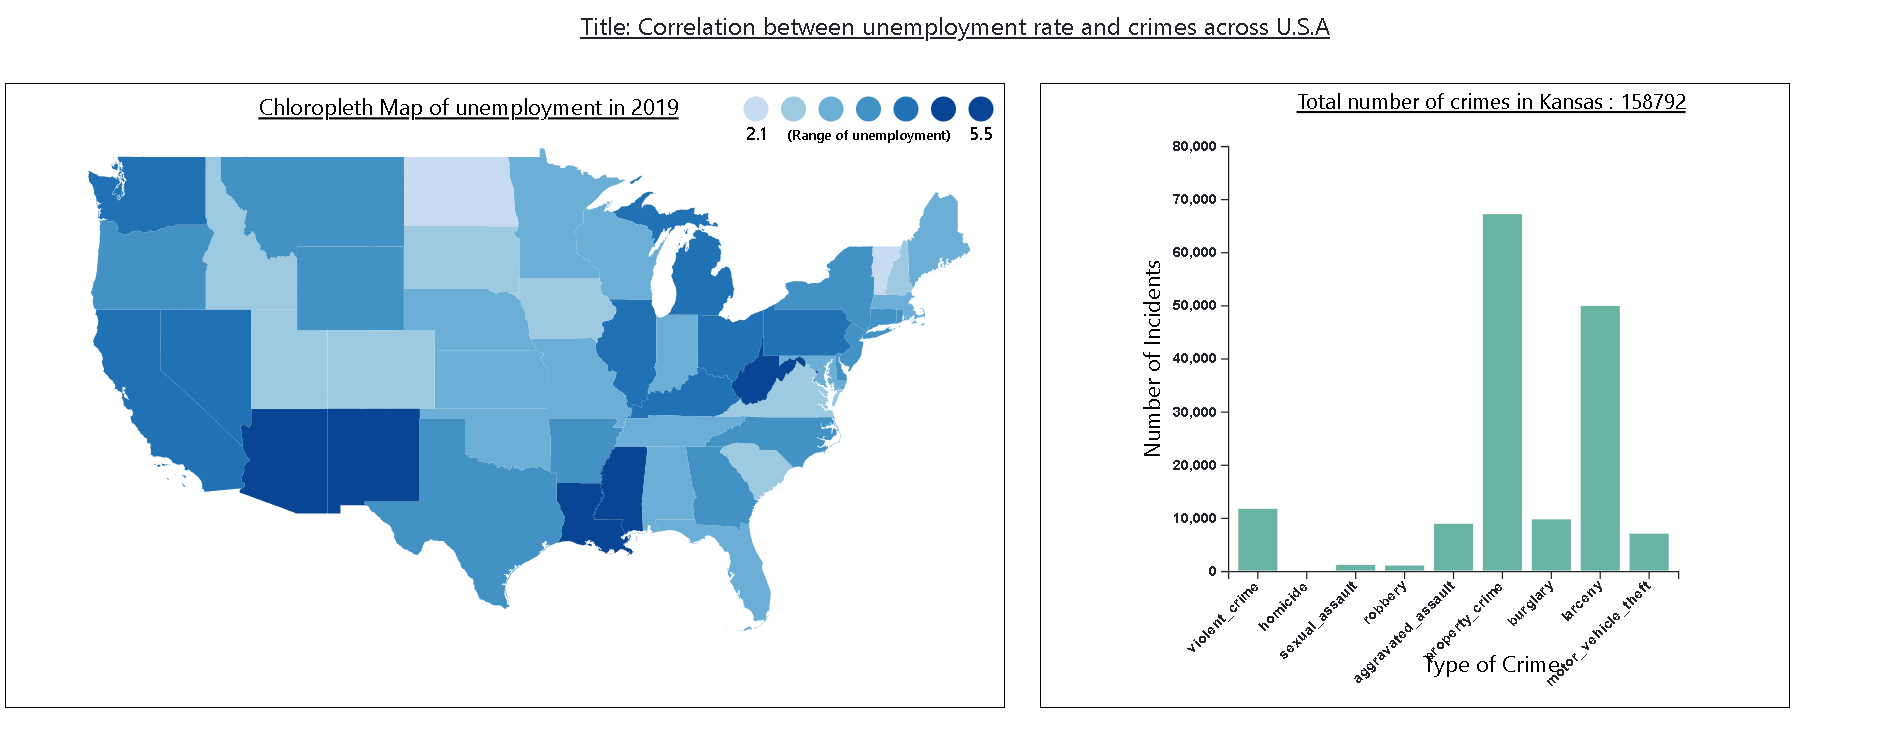
Mapping unemployment and crime rate across USA

Understanding the relationship between crime rates and unemployment is crucial for developing effective
social and
economic policies. This project delves deep into the intricate dynamics between these two significant
factors across
various states in the USA. By employing javascript library for visualizing data, we aim to uncover
patterns
and
correlations that are not immediately apparent in raw data. This exploration is particularly relevant in
the
current
socio-economic climate, where fluctuations in employment rates and concerns about public safety are at
the
forefront of
policy discussions. By examining how changes in unemployment rates impact crime rates, this project
seeks to
provide
valuable insights that can inform more targeted and effective interventions.
This visualization focuses on a state-by-state analysis to capture the diverse socio-economic landscapes across the United States. Different states exhibit varying levels of unemployment and crime, influenced by factors such as economic conditions, demographic composition, and local policies. By leveraging a range of data visualization tools and libraries, we will highlight these regional differences and explore potential causal relationships. The insights gained from this project will not only contribute to academic and policy-making discussions but also support community leaders and stakeholders in crafting strategies to combat unemployment and reduce crime.
The database is simple and easy to use, with just two columns: state name and the calculated unemployment percentage. This makes it straightforward to find and understand the key information.


This visualization focuses on a state-by-state analysis to capture the diverse socio-economic landscapes across the United States. Different states exhibit varying levels of unemployment and crime, influenced by factors such as economic conditions, demographic composition, and local policies. By leveraging a range of data visualization tools and libraries, we will highlight these regional differences and explore potential causal relationships. The insights gained from this project will not only contribute to academic and policy-making discussions but also support community leaders and stakeholders in crafting strategies to combat unemployment and reduce crime.
Links for Dataset used:
Data preprocessing:
In our unemployment rates database, we gathered monthly data for each state and calculated the yearly average to give a clearer picture of unemployment over the year. We also added a column showing the percentage of the population that's unemployed. This was done by dividing the total number of unemployed people in each state by the total civilian non-institutional population and multiplying by 100.The database is simple and easy to use, with just two columns: state name and the calculated unemployment percentage. This makes it straightforward to find and understand the key information.
Language and libraries used: